Bird’s eye view of price and risk

This week, we learned that the US index of leading economic indicators (Conference Board LEI) contracted to 99.5 in October—the 32nd consecutive month of contraction and the longest since at least 1957 (all shown below courtesy of The Daily Shot).
The only LEI items that expanded in October were stock (green) and credit (pink) prices. But who needs economic strength when risk markets are jubilant. Tech-heavy US equity funds have continued attracting record global inflows year to date.
Since the US election, Bitcoin and Tesla shares have surged about 36%. Other global markets and assets have seen capital outflows (below since the election), which has helped the US dollar index (DXY) move above 107—the highest since November 2022. Chip leader NVIDIA, with a market capitalization (shares x price) of $3.6 trillion, trading more than 32 times expected 2025 sales, now accounts for 7% of the S&P 500 price. The top 7 most expensive companies–all in the tech space–account for just over 30% of the index value (as shown below). Rarely has the fate of so many depended on the continued euphoric pricing of so few. 
Further magnifying risk exposure, assets in leveraged security funds (blue line below since 2001, with S&P 500 in black) have taken out the 2022 peak. A retail offering of levered single-stock funds is a new weapon of mass destruction to magnify the downside from here (green line below since November 2023).

Hedge funds also had a median 72% of their long holdings concentrated in 10 stocks in September, the highest since 2019 and 2000 (shown below since 2002).

The latest narratives around AI, central banks’ omnipotence, and Trump’s promises have once more convinced the masses that the price is irrelevant. The S&P 500, trading at 24x estimated forward earnings, is the fourth-highest multiple since 1900 (as shown below), and all prior incidents ended in widespread financial pain. In April 2004, just after the 2000-03 stock bubble implosion, behavioural finance pioneer Daniel Kahneman gave an interview where he identified common mistakes investors make (thanks to Dennis Gartman for reminding me of it this morning).

Although Danny left us last March, his insights are timeless. See Clients Misbehavin’: An interview with Nobel Laureate Daniel Kahneman. Here are some interview highlights.

People mainly think of risk in terms of downside risk. They are concerned about the maximum they can lose. So that’s what risk means. In contrast, the professional view defines risk in terms of variance, and doesn’t discriminate gains from losses. There is a great deal miscommunication and misunderstanding because of these very different views of risk. Beta does not do it for most people, who are more concerned with the possibility of loss.

This is why individual investors typically will get in too late. By the time they convince themselves that everybody else is getting rich and they are the only ones not getting rich, it is probably late in the day. When those investors get in, it may be time for other people to get out. There is a psychological phenomenon that we are aware of which is that people see patterns in pure noise, where in fact there are no patterns at all. So people are prone to think that the world has changed, and they do not appreciate that the next turn is near.

During the bubble, there was some talk that the rules of the economy had been suspended, that we were in a new world where things can go straight up forever. Quite a few people almost believed that. We are very vulnerable to seeing random fluctuations as indications of permanent change, a new pattern.

The advisor is in a very difficult position, in that you want to do the best for your client but you also want to have clients. So it is a difficult world, but that’s the place we live in. The best advice may well be, “Do little and don’t think too much,” and “Leave it to me and don’t check your results too frequently because that will cause you to make mistakes,” but this advice can sound very self-serving. For good advice to be acceptable, we are dependent on the public getting educated.

Posted in Main Page | Comments Off on Bird’s eye view of price and risk

Even higher hopes

The S&P 500 is on track for its biggest election-year gain in 88 years. Still, according to the latest Conference Board Consumer Confidence Survey, the share of US consumers expecting stocks to rise further over the next 12 months has doubled over the last year to the highest percentage since this question was first asked in 1987 (chart below courtesy of Global Macro Investors and Rosenberg Research).

Meanwhile, corporate executive insider stock selling as a ratio of buying also reached an all-time high this month; see Corporate Insiders cash in on the post-election US stock market surge (chart below since 2000). Executives selling their holdings into the flows of their company share buybacks ought to be illegal, but this form of insider trading has become routine.
Unfortunately, high hopes among retail observers have regularly presaged portfolio losses. Most trying to ‘trade’ or buy and hold securities fall victim to extreme volatility and emotions, adding more capital as prices leap and liquidating after losses.

Real-world return data confirm that most individuals do better steering clear altogether. But at times like this, doing the right thing can feel hard to do.

Posted in Main Page | Comments Off on Even higher hopes

Euphoria bounces back

Since stock markets hit a two-year low last October, prices reflated on bets that artificial intelligence and central bank easing could solve spreading insolvency. Then came this month’s Republican sweep in the US election, and the crowd ordered another round.

Risky assets went parabolic before selling off last week—the S&P 500 and Canada’s TSX remain 3.3% and 4% higher than on October 31.

Rising security prices have further loosened financial conditions for publicly traded companies, and US Fed members have talked down easing expectations once more.

The trouble is that Treasury yields set fixed-term interest rates in the economy, and those have risen. Debt-carrying costs and elevated housing expenses—shelter accounting for about a third of Canada and America’s overall Consumer Price Indexes—continue to exert elevated strain on the masses.

As the Bank of Canada delivered 125 basis points of rate cuts since July, the Loonie has tumbled along for the ride, further inflating the cost of goods for Canadians.

The three other periods in the last 25 years when central banks have lowered policy rates in 50 basis point+ increments were during major financial dislocations: 2001, 2008 and 2020. In all three incidents, the backup in Treasury yields proved short-lived before safety-seeking flows accelerated into government bonds and caused their yields to fall.

With half of Canadian mortgages renewing in 2025, rate relief can’t come fast enough. Mortgage rates have historically bottomed with Treasury yields many months and quarters after the first Fed cut.

The recent jump in the US 10-year yield since the Fed’s first rate cut (green line below courtesy of MRB Partners and The Daily Shot) stands out as far above the median (dotted line) and range (grey shading) since 1995.

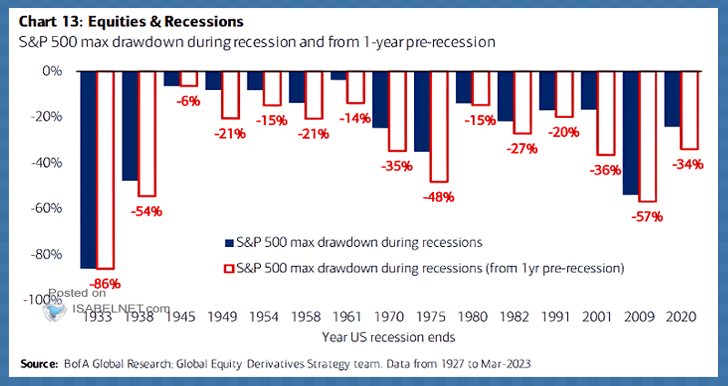
Since 1969, recessions have begun shortly after the first Fed cut, and the stock market did not bottom until months later.

As a starting point, today’s over-pricing and concentration in US stocks relative to the rest of the world have never been higher (shown below since 1950, courtesy of Bank of America and The Daily Shot). Lesser overshoots in 1966 and 2000 resolved in secular global bear markets that spent years growing back losses.
Just 5 US tech stocks account for a record 15% of the global equity market capitalization (blue line below since 1973, courtesy of Goldman Sachs), nearly double the weight seen at the 2000 tech top. The top 10 most expensive US companies account for 21% (black line).
Twenty-four years older than in 2000, and apparently none the wiser, the masses today hold the highest portion of their life savings at risk since the infamous bubble peaks of 2000, 2007 and 2021 (household equity allocations below since 1950 in blue versus bonds in black and cash in grey, courtesy of Goldman Sachs and The Daily Shot). Their odds aren’t good, and it’s not just Americans at risk here. All we know is that there has never been an asset bubble that did not collapse, and today’s stock market bubble has never been so vast and obvious. Of this, we can be sure.

Posted in Main Page | Comments Off on Euphoria bounces back